The unreasonable effectiveness of sys.settrace (and sys.setprofile)
CPython allows for incredible introspection: settrace and setprofile
can observe and control just about everything from within the
program. The official documentation doesn't do enough justice to these
functions, and so I decided to take a stab at it.
sys.settrace sets a trace function that is triggered by the VM
every time it enters or exits a function, processes a line of code,
runs into an exception and even when it runs a single
opcode. Each of these callbacks also give full access to the current
stack frame and code.
sys.setprofile sets a trace function that's triggered every time the
VM enters or exits both Python and C functions.
There are equivalents available in the threading module to allow
setting tracers for multi-threaded programs as well:
threading.settrace and threading.setprofile.
The frame object contains the current state of computation: all
locals, globals, current location, etc.; the code object has the
actual opcodes and function details independent of the current
stack.
Frighteningly enough, it's also possible to modify the state of the program using the frame: so it's possible to override locals, globals, or simply skip around by changing the offset into the bytecode.
Cheat Sheet
sys.settrace(fn)andsys.setprofile(fn)to setfnas the callback.sys.settrace(None)andsys.setprofile(None)to clear it.- The trace function has the function signature
(frame, event, arg). settraceevents:call,return,line,exception,opcodesetprofileevents:call,c_call,return,c_return,c_exception- The return value is used in all but
returnto specify the new local trace function forsettrace, and is unused forsetprofile. argdepends on the eventc_call,c_return,c_exception: C function objectreturn: The return value,Nonefor exceptionsexception: (exception,value,traceback)tuple
framefieldsf_back:previous framef_code: code objectf_locals: as titlef_globals: as titlef_builtins: built-in namesf_lasti: instruction, index into bytecode stringf_trace: writable, set the trace function for this framef_trace_lines: writable, trigger trace for each linef_trace_opcodes: writable, trigger trace for each opcodef_lineno: writable, current line number
codefields (immutable)co_name: function nameco_argcount: positional argumentsco_posonlargcount: positional-only argumentsco_kwonlyargcount: keyword-only argumentsco_nlocals: # of local variables used by the function, including argsco_varnames: tuple with names of local variablesco_cellvars: tuple with local vars referred to by nested functionsco_freevars: tuple with free variablesco_code: bytecode as a stringco_consts: tuple with literals used by bytecode- first item is docstring or None for functions
co_names: tuple with names used by bytecodeco_filename: origin filenameco_firstlineno: first line number of functionco_lnotab: maps bytecode offsets to line numbersco_flags: flags for interpreter0x04: uses *arguments0x08: uses **keywords0x20: generator0x2000: from future import division
A full example of a settrace
A short Fibonacci loop serves as a good example to show the values inside a trace.
def fib(n):
    i, f1, f2 = 1, 1, 1
    while i < n:
        f1, f2 = f2, f1 + f2
        i += 1
    return f1
show_trace is a simple tracing function to give a live example. Note
that f_trace_opcodes needs to be explicitly set to True to trace
opcodes in the frame, and import opcode gets the opcode number to name
mapping.
import opcode


def show_trace(frame, event, arg):
    frame.f_trace_opcodes = True
    code = frame.f_code
    offset = frame.f_lasti

    print(f"| {event:10} | {str(arg):>4} |", end=' ')
    print(f"{frame.f_lineno:>4} | {frame.f_lasti:>6} |", end=' ')
    print(f"{opcode.opname[code.co_code[offset]]:<18} | {str(frame.f_locals):<35} |")
    return show_trace
Finally, actually triggering the trace – and pretty printing the
output. Here we see the bytecode actually being executed; in contrast,
dis.dis shows the disassembled bytecode representing the function.
import sys

header = f"| {'event':10} | {'arg':>4} | line | offset | {'opcode':^18} | {'locals':^35} |"
print(header)
sys.settrace(show_trace)
fib(3)
sys.settrace(None)
| event      |  arg | line | offset |       opcode       |               locals                |
| call       | None |    1 |      0 | RESUME             | {'n': 3}                            |
| line       | None |    2 |      2 | LOAD_SMALL_INT     | {'n': 3}                            |
| opcode     | None |    2 |      2 | LOAD_SMALL_INT     | {'n': 3}                            |
| opcode     | None |    2 |      4 | LOAD_SMALL_INT     | {'n': 3}                            |
| opcode     | None |    2 |      6 | LOAD_SMALL_INT     | {'n': 3}                            |
| opcode     | None |    2 |      8 | STORE_FAST_STORE_FAST | {'n': 3}                            |
| opcode     | None |    2 |     10 | STORE_FAST         | {'n': 3, 'f1': 1, 'f2': 1}          |
| line       | None |    3 |     12 | LOAD_FAST_BORROW_LOAD_FAST_BORROW | {'n': 3, 'i': 1, 'f1': 1, 'f2': 1}  |
| opcode     | None |    3 |     12 | LOAD_FAST_BORROW_LOAD_FAST_BORROW | {'n': 3, 'i': 1, 'f1': 1, 'f2': 1}  |
| opcode     | None |    3 |     14 | COMPARE_OP         | {'n': 3, 'i': 1, 'f1': 1, 'f2': 1}  |
| opcode     | None |    3 |     18 | POP_JUMP_IF_FALSE  | {'n': 3, 'i': 1, 'f1': 1, 'f2': 1}  |
| opcode     | None |    3 |     22 | NOT_TAKEN          | {'n': 3, 'i': 1, 'f1': 1, 'f2': 1}  |
| line       | None |    4 |     24 | LOAD_FAST_LOAD_FAST | {'n': 3, 'i': 1, 'f1': 1, 'f2': 1}  |
| opcode     | None |    4 |     24 | LOAD_FAST_LOAD_FAST | {'n': 3, 'i': 1, 'f1': 1, 'f2': 1}  |
| opcode     | None |    4 |     26 | LOAD_FAST_BORROW   | {'n': 3, 'i': 1, 'f1': 1, 'f2': 1}  |
| opcode     | None |    4 |     28 | BINARY_OP          | {'n': 3, 'i': 1, 'f1': 1, 'f2': 1}  |
| opcode     | None |    4 |     40 | STORE_FAST_STORE_FAST | {'n': 3, 'i': 1, 'f1': 1, 'f2': 1}  |
| line       | None |    5 |     42 | LOAD_FAST_BORROW   | {'n': 3, 'i': 1, 'f1': 1, 'f2': 2}  |
| opcode     | None |    5 |     42 | LOAD_FAST_BORROW   | {'n': 3, 'i': 1, 'f1': 1, 'f2': 2}  |
| opcode     | None |    5 |     44 | LOAD_SMALL_INT     | {'n': 3, 'i': 1, 'f1': 1, 'f2': 2}  |
| opcode     | None |    5 |     46 | BINARY_OP          | {'n': 3, 'i': 1, 'f1': 1, 'f2': 2}  |
| opcode     | None |    5 |     58 | STORE_FAST         | {'n': 3, 'i': 1, 'f1': 1, 'f2': 2}  |
| opcode     | None |    5 |     60 | JUMP_BACKWARD      | {'n': 3, 'i': 2, 'f1': 1, 'f2': 2}  |
| line       | None |    3 |     12 | LOAD_FAST_BORROW_LOAD_FAST_BORROW | {'n': 3, 'i': 2, 'f1': 1, 'f2': 2}  |
| opcode     | None |    3 |     12 | LOAD_FAST_BORROW_LOAD_FAST_BORROW | {'n': 3, 'i': 2, 'f1': 1, 'f2': 2}  |
| opcode     | None |    3 |     14 | COMPARE_OP         | {'n': 3, 'i': 2, 'f1': 1, 'f2': 2}  |
| opcode     | None |    3 |     18 | POP_JUMP_IF_FALSE  | {'n': 3, 'i': 2, 'f1': 1, 'f2': 2}  |
| opcode     | None |    3 |     22 | NOT_TAKEN          | {'n': 3, 'i': 2, 'f1': 1, 'f2': 2}  |
| line       | None |    4 |     24 | LOAD_FAST_LOAD_FAST | {'n': 3, 'i': 2, 'f1': 1, 'f2': 2}  |
| opcode     | None |    4 |     24 | LOAD_FAST_LOAD_FAST | {'n': 3, 'i': 2, 'f1': 1, 'f2': 2}  |
| opcode     | None |    4 |     26 | LOAD_FAST_BORROW   | {'n': 3, 'i': 2, 'f1': 1, 'f2': 2}  |
| opcode     | None |    4 |     28 | BINARY_OP          | {'n': 3, 'i': 2, 'f1': 1, 'f2': 2}  |
| opcode     | None |    4 |     40 | STORE_FAST_STORE_FAST | {'n': 3, 'i': 2, 'f1': 1, 'f2': 2}  |
| line       | None |    5 |     42 | LOAD_FAST_BORROW   | {'n': 3, 'i': 2, 'f1': 2, 'f2': 3}  |
| opcode     | None |    5 |     42 | LOAD_FAST_BORROW   | {'n': 3, 'i': 2, 'f1': 2, 'f2': 3}  |
| opcode     | None |    5 |     44 | LOAD_SMALL_INT     | {'n': 3, 'i': 2, 'f1': 2, 'f2': 3}  |
| opcode     | None |    5 |     46 | BINARY_OP          | {'n': 3, 'i': 2, 'f1': 2, 'f2': 3}  |
| opcode     | None |    5 |     58 | STORE_FAST         | {'n': 3, 'i': 2, 'f1': 2, 'f2': 3}  |
| opcode     | None |    5 |     60 | JUMP_BACKWARD      | {'n': 3, 'i': 3, 'f1': 2, 'f2': 3}  |
| line       | None |    3 |     12 | LOAD_FAST_BORROW_LOAD_FAST_BORROW | {'n': 3, 'i': 3, 'f1': 2, 'f2': 3}  |
| opcode     | None |    3 |     12 | LOAD_FAST_BORROW_LOAD_FAST_BORROW | {'n': 3, 'i': 3, 'f1': 2, 'f2': 3}  |
| opcode     | None |    3 |     14 | COMPARE_OP         | {'n': 3, 'i': 3, 'f1': 2, 'f2': 3}  |
| opcode     | None |    3 |     18 | POP_JUMP_IF_FALSE  | {'n': 3, 'i': 3, 'f1': 2, 'f2': 3}  |
| line       | None |    6 |     64 | LOAD_FAST_BORROW   | {'n': 3, 'i': 3, 'f1': 2, 'f2': 3}  |
| opcode     | None |    6 |     64 | LOAD_FAST_BORROW   | {'n': 3, 'i': 3, 'f1': 2, 'f2': 3}  |
| opcode     | None |    6 |     66 | RETURN_VALUE       | {'n': 3, 'i': 3, 'f1': 2, 'f2': 3}  |
| return     |    2 |    6 |     66 | RETURN_VALUE       | {'n': 3, 'i': 3, 'f1': 2, 'f2': 3}  |
The underlying code of a function is directly accessible with the
__code__ field, and is also the value stored in the frame's co_code field.
import inspect

code = fib.__code__
print(f"{'field':<20} | value")
for name, val in inspect.getmembers(code):
    if name.startswith("co_"):
        print(f"{name:<20} | {val}")
field                | value
co_argcount          | 1
co_branches          | <built-in method co_branches of code object at 0x7faa294c4390>
co_cellvars          | ()
co_code              | b'\x80\x00^\x01^\x01^\x01r2p\x01W\x108\x12\x00\x00d\x15\x00\x00\x1c\x00Y2V\x03,\x00\x00\x00\x00\x00\x00\x00\x00\x00\x00\x00r2V\x01^\x01,\r\x00\x00\x00\x00\x00\x00\x00\x00\x00\x00p\x01K\x1a\x00\x00V\x02#\x00'
co_consts            | (1,)
co_exceptiontable    | b''
co_filename          | /tmp/python-eZMVs3
co_firstlineno       | 1
co_flags             | 3
co_freevars          | ()
co_kwonlyargcount    | 0
co_lines             | <built-in method co_lines of code object at 0x7faa294c4390>
co_linetable         | b'\x80\x00\xd8\x10\x11\x901\x90a\x882\x80A\xd8\n\x0b\x8c%\xd8\x11\x13\x98"\x95W\x88B\xd8\x08\t\x88Q\x8d\x06\x8a\x01\xd8\x0b\r\x80I'
co_lnotab            | b'\x02\x01\n\x01\x0c\x01\x12\x01\x16\x01'
co_name              | fib
co_names             | ()
co_nlocals           | 4
co_positions         | <built-in method co_positions of code object at 0x7faa294c4390>
co_posonlyargcount   | 0
co_qualname          | fib
co_stacksize         | 3
co_varnames          | ('n', 'i', 'f1', 'f2')
Potentially useful patterns
A completely programmable ad-hoc debugger
I've found settrace with a simple function to be extremely valuable in
understanding code.
Instead of learning even more arcane commands and manually stepping
through programs with pdb, I can directly write my "pause" and "inspect" logic
into the trace function and keep iterating on the program – while
also filtering the output to files I care about.
The tracer module also helps with directly tracing and dumping the
code, but I generally find it too unwieldy compared to directly using settrace.
Building code execution visualizations
Working on mine is what inspired this note: it's not hard to imagine
beautiful ways to display code execution. My approach is to use
Catapult (chrome://tracing) for rendering the execution, but it could
just as easily be on the source itself inside an IDE.
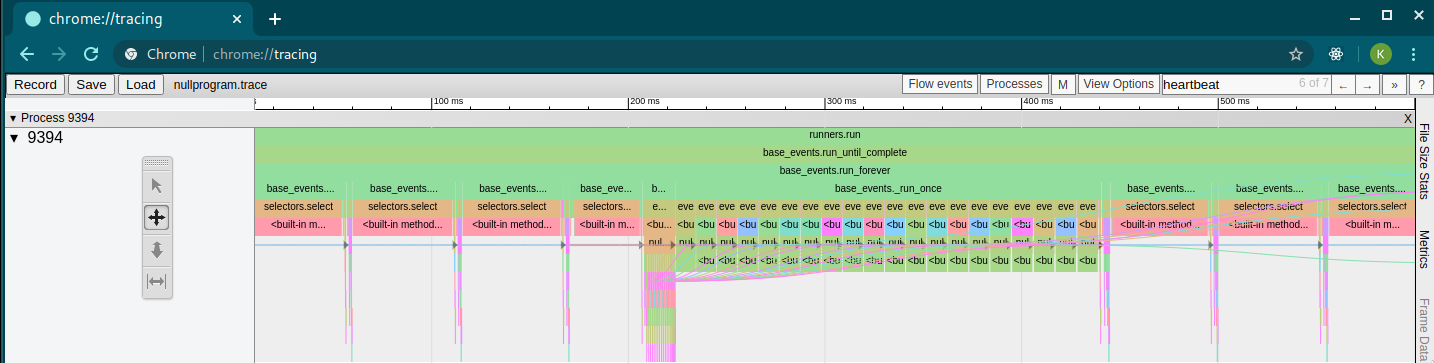
Figure 1: Visualizing the broken behavior described in nullprogram
Test coverage
settrace makes it trivial to observe the lines of code executed in any
specific program run, and the underling C function is how coverage.py works.
They didn't stop to think if they should
Jump to arbitrary parts of a function
I vaguely remember seeing a Hacker News post about jump implemented
with settrace and then directly writing to the frame offset.
Recreating that is left as an exercise to the reader.
Rewrite arguments on the fly
For bonus points, you can include this code and have it trigger randomly.
import sys

def square_arguments(frame, event, arg):
    if event != "call":
        return

    code = frame.f_code
    if code.co_name != "add":
        return

    for var in frame.f_locals:
        frame.f_locals[var] = frame.f_locals[var] ** 2

def add(a, b):
    return a + b

print(f"add(1, 2): {add(1, 2)}")

sys.settrace(square_arguments)
print(f"add(1, 2): {add(1, 2)}")
add(1, 2): 3
add(1, 2): 5
Not quite a deus-ex machina
Tracing doesn't capture coroutine creation, which would be
amazing. With sys.set_coroutine_origin_tracking it's possible to get a
stack trace to where a specific coroutine was created, but I'd love
for that step to also pass through settrace / setprofile.
It's also not directly possible to set this from outside an arbitrary running program that I know of.
Finally, setprofile intercepts and shares exceptions thrown from C
code, but doesn't intercept Python exceptions. I'm not quite sure why.
References
sys.settracein the standard python documentation.- The Python Type Hierarchy, with definitions of frame and code objects.
- inspect, with very readable documentation that makes my cheat sheet irrelevant.
Comments?
Drop me an email or reach out on Twitter.
History
- 2020-06-13: Published.
- (TODO Explore
PyEval_SetTrace.)