EE > Do the Work: Mechanical Tactics
The previous section was somewhat philosophical and possibly disappointing in its abstractness: in this section we'll go in the opposite way and talk through some of the more tactical approaches that have worked for me.
Hack it up any which way
A.k.a try to swallow the elephant in a single bite. I realize this sounds counter-intuitive (and impossible), but trying to quickly prototype a working end-to-end solution can generally pay outsized rewards. There are a couple of important parts I'd like to highlight:
- The hack must be end-to-end; to really get the value from this process you need to touch every part that will be involved in a real solution.
- You must timebox yourself: one of the points of this exercise is to identify the rabbit holes, not fall down every single one of them.
- Focus on making something that works: it doesn't need to be well designed, most of it can be hardcoded – you could simply write everything into a single 5,000 line file to avoid imports if you want to – free yourself from any “good practices”.
- You're not aiming to commit – or ship – any of this; remind others looking over your shoulder as well just in case. I'll often hard-code in names like “Foo” and “bar” to remind myself and others that this is in no way meant for real world use.
There are a lot of valuable outcomes from this approach:
- You'll get a much better appreciation for the actual work involved, and will have a surprisingly good idea of what “shape” the solution could take.
- There's a far lower likelihood of running into unknown unknowns and magical surprises as you learn to navigate the full system.
- You'll identify the riskiest parts that need to be done, as well as the easiest ones; this can also help you both delegate and estimate work with much more confidence.
- You'll be able to empirically test your mental model and confirm that it applies.
- There are few things more powerful than a working demo to align people: giving them something tangible to play with makes sure you're all working towards a common goal.
Make small changes to build confidence
This is the part where you start nibbling at the edges of your (virtual) elephant to build up confidence that you'll actually be able to eat it all some day. Learn to work in your new project, the build and release process, how tests work, simply getting through code review and other processes to get your changes deployed.
I recommend making small changes and simply tidying up your workplace. Clean up existing lints, add more test coverage, improve the quality of the tests that do exist; fix spellings; add instrumentation; improve the documentation – particularly by adding examples. Make simple, easy to understand – preferably non functional – changes that will run in production. Make sure you can find out if they work correctly once they reach customers.
Along the way, you'll gain goodwill from your team, have something to show for all the time you've been spending ramping up on the system, and get that glow of satisfaction at actually landing something instead of rotating in place for months.
Take small steps from a known good state to a known good state
This part is a reminder to take small bites that you can chew (in complete contrast to the very first piece of advice I gave you). Because there are so many unknowns in this system, once you're actually working on a solution – move carefully. Make sure the system runs as you expect it to; make a small change, validate that it works again (similar to – but not necessarily the same as – test driven development).
If the results diverge from your mental model at any point you can immediately backtrack and identify what changed in the small step you took, instead of having to bisect a large swathe of changes (and possibly having to determine that two changes overlapped to cause issues). This simple mechanical behavior can save you hours of debugging and working backwards to identify unintentional consequences.
At times, it can take a little bit of humility to constrain yourself to small changes instead of giant leaps; you're most likely to learn the same way I did – which is to fail often enough till you learn to make small but confident steps. (Hat tip to Kent, who helped me work through this several times at the start of my career.)
Look around the boundaries
(Credit for this section goes to Ivan Savov who pointed out that I never covered the importance of looking at the data.)
Your project almost certainly interacts with several other systems, some of which may be significantly easier to learn from. Look at the inputs, outputs, and persisted state of your program to see what's going on.
Data
Accessing the databases, flat file storage and looking at what's saved can make the details of the system significantly more concrete. If you don't have access to the raw data, try to look up the schema of the different tables to see what's available where, and you can work backwards. **Wilko Nienhaus**: Fred Brooks comes to mind: “Show me your flowcharts and conceal your tables, and I shall continue to be mystified. Show me your tables, and I won't usually need your flowcharts; they'll be obvious.” I share that experience: a look at the database structure usually tells me most of how something is built/working.
In certain types of applications: eg. browser applications – client side data storage is extremely standardized and very inspectable (look through the Chrome DevTools tab labeled “Application” if you haven't.)
RPCs
On a similar note, any remote calls – particularly those that involve structured code-generation or serialization like Thrift and protocol buffers can be other more easily accessible entry points.
This works both ways as well: you should sneak a peek at the calls your system makes on others, and the calls other systems make on yours to get a sense of the inputs & outputs.
Reading code is insufficient
From a tactical perspective, simply reading code is not empirical evidence: you need to run it, and see exactly what it's doing. Simply reading code can be very misleading – you can never be sure what's overriding behavior in production. It could be something as cartoonish as an “#define false true” to something more realistic like compiler optimizations eliding code paths you care about.
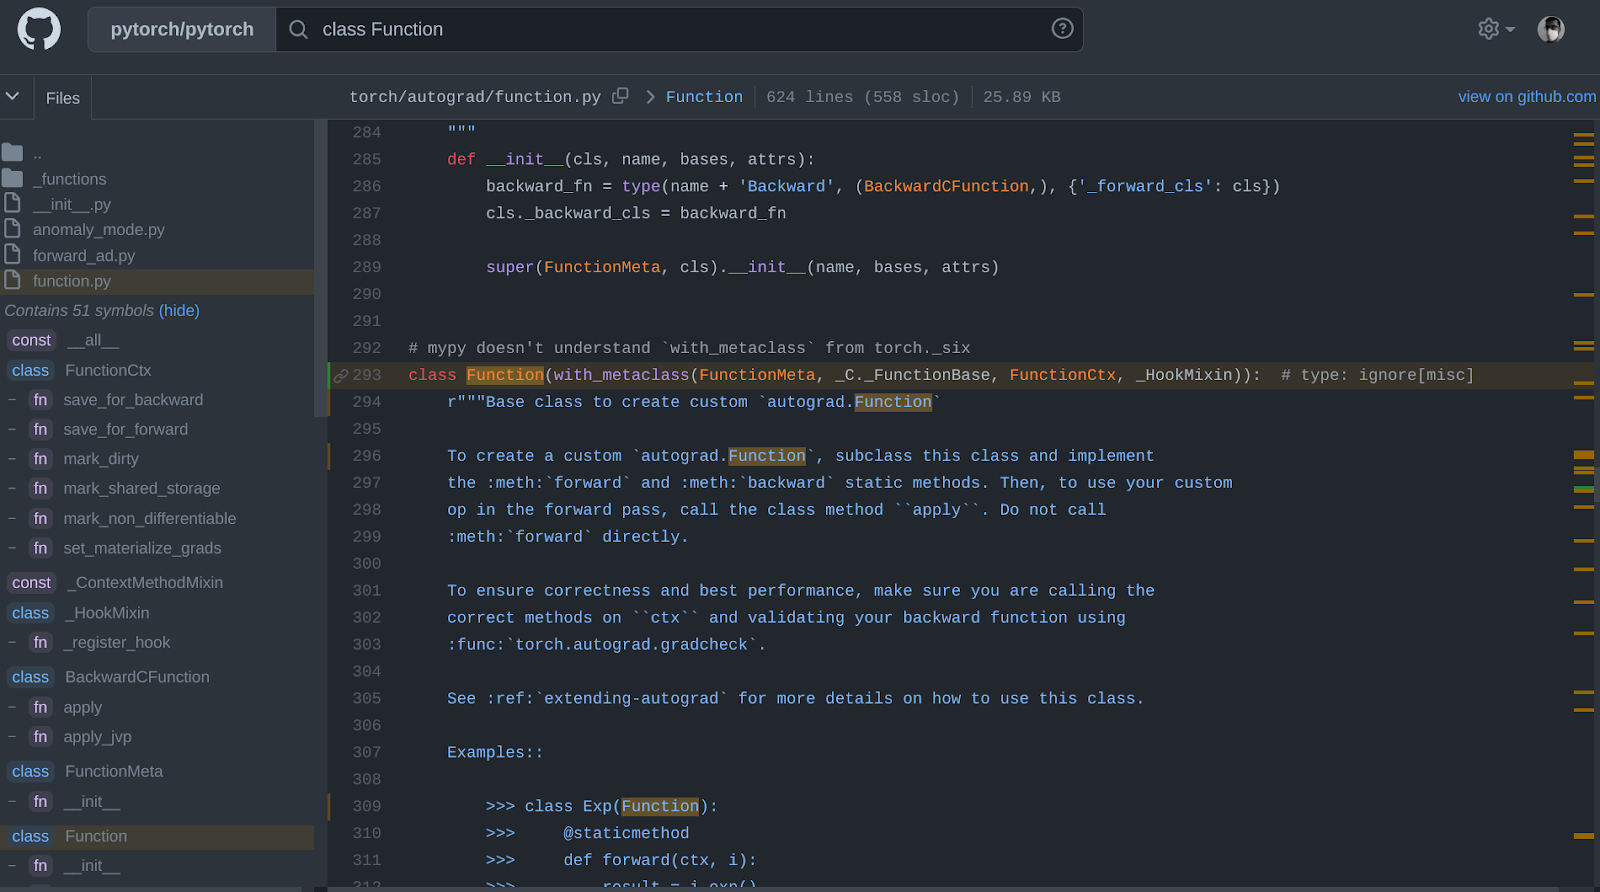
Reaching for an example from something I've been working on recently: PyTorch supports several transforms to make your easy-to-modify but slow-to-run model into something that's extremely fast. But if you didn't know that it's going to be traced, you're going to have completely broken assumptions on what runs. Here's an example from torch.fx where my beloved debugging mechanism – a print statement – gets elided:
import torch

class MyModule(torch.nn.Module):

    def __init__(self):
        super().__init__()
        self.param = torch.nn.Parameter(torch.rand(3, 4))
        self.linear = torch.nn.Linear(4, 5)

    def forward(self, x):
        print(f"A wild print appeared! {x=}")
        return self.linear(x + self.param).clamp(min=0.0, max=1.0)
The traced equivalent that will run (notebook for proof):
def forward(self, x):
    param = self.param
    add = x + param; x = param = None
    linear = self.linear(add); add = None
    clamp = linear.clamp(min = 0.0, max = 1.0); linear = None
    return clamp
It's not just PyTorch: I've run into similar surprises across ART (while running the debugger), C optimizations, and other brilliant magic.
Look for fingerprints
While ideally you'd be able to navigate a project simply based on a good folder structure, consistent naming schemes and obvious class naming patterns, reality tends to be significantly messier. It can be much easier to find an entry point by looking up fingerprints of other engineers and pulling on a thread starting from that point.
Some common fingerprints I use to quickly find a starting point to navigate:
- Unminified CSS class names
- User facing messages, particularly if they include rare phrases
- Specific combinations of words in log messages, making them easier to grep for
Looking for these generally takes me directly to a string or a constant that I can then follow through all the way.
Of course, this is more an art than a science: any of these strings could be generated dynamically; or you might be extremely unlucky and the phrase might end up being split up across multiple lines instead.
Pay close attention to the logs and program outputs
Be extremely conscientious while reading logs: it's too easy to miss something obvious right in front of you. Most of the logs correspond to something someone else thought was interesting about the program's behavior; you're likely to benefit by paying a little bit of attention.
Sadly, more often than not logs tend to be unfortunately spammy, occasionally out of order (if parallelism or concurrency is involved): don't hesitate to pull them together into an editor for quick manipulation. You'd be surprised at just how readable logs can be when formatted and highlighted correctly.
One of my favorite tactics is to collect all logs or compiler output into a file that I then manipulate in Vim: I delete everything extraneous, and reformat the bits I care about. Versioning these abbreviated log files makes change much easier to observe and dissect. In extreme cases, consider post processing the logs and visualizing them manually – a few lines of python in a notebook could save you hours of spelunking.
Look out for any instrumentation
Any live instrumentation that captures the system's execution is the last set of data I'd recommend pulling up. Instrumentation should help you build empathy with how the system executes: do requests take milliseconds, seconds, or minutes? What does p99, p99.9, p99.99 latency look like? How many resources are consumed? Is this code CPU bound, I/O bound, or neither?
I almost never trust instrumentation and metrics that are handed to me: at the very least, I'd like to trace a single data point (that I generated manually) through the pipelines, and then I can accept that it's at least partially working. If you can triangulate metrics through multiple different sources, it's worth the investment. If you run across complex metrics that are hard to explain, don't rely on them for anything but sanity checks: look for simpler, direct metrics to actually guide your decisions as you explore the code.
Learn to speed read code
Even though relying solely on reading code is misleading, you still need to be able to skim it really quickly. The same rules for reading books fast also apply to reading code: focus on the interfaces instead of digging deeply into the implementations, spend your time on critical pieces.
Incrementally building your mental model (as described above) and taking thorough notes along the way (as described near the end) should help you move faster and remember what's going on.
You should figure out ways to quickly navigate your code base for this to work really well. Some editors also offer bookmarks to be able to jump back and forth between interesting points quickly.
Read the commit history
Less obviously, see how the code evolved: go spelunking into the commit history and look for major decisions for the parts of the code base you're interested in. I like to jump to the commit that introduced that particular file/class/function to see the original intent for adding it, without the cruft that might have grown up around it over the years. Then you can skip along to any major refactors or structural changes that render it unrecognizable.
Commit messages should ideally include links to other discussions, tasks, comments and reviews that you might also find incredibly valuable to gain context.
Look for design documents & discussions
Look for any old design documents or discussions that might be hanging around: this can also act as an excellent reference to find more people to talk to. One of the most important pieces of context you should gather is the set of problems that this piece of code was meant to solve, and then to determine which of those problems is still applicable or if there are new ones that must be addressed.
Lean on your tools
As you ramp up, don't ignore the tools available: you'll probably bring some along based on your past experience, but also take the time to learn the ones built for your current problem. For example, Android Studio encodes (and automates away) a tremendous amount of knowledge and conventions you'd otherwise need to manually look up and follow to build anything with Android – I couldn't recommend using Emacs for it.
Ideally, you should understand the strengths and weaknesses of the tools you have available, and build some intuition on when to use what – this knowledge inevitably compounds over time. One path is to use them on a trivial problem and identify how the tool works. Understanding how – and why – they work will help you be that much more effective with them.
I optimistically started writing this section and later realized that there was no realistic way to cover all the tools (or types of tools) available; I'm just covering some of the tools you might find useful to apply the tactics covered in the previous sections.
Tools to understand programs while building them
The humble print statement
Seibel: When you're debugging, what tools do you use?
Thompson: Mostly I just print values. […] Whatever I need; whatever is dragging along. Invariants. But mostly I just print while I'm developing it.
The very first tool I'll reach for while exploring and debugging is still a print statement. I generally use stacked commits at work and will keep an unpublished commit at the top of the stack that simply adds log statements everywhere.
Most of the time you'll find that print statements generally don't change the nature of the program's execution, slow things down too much or carry unpleasant surprises; and given how fundamental input/output are to any programming environment, they're much less likely to be broken.
Sometimes you might run into scenarios where you can't safely write to stdout/stderr: either because they've been co-opted for other purposes (like the actual point of the program), or are so full of spam that you can't do anything meaningful with them (more on this later). In that case, I'll simply open a custom log file in a fixed folder (generally prefixed with a uuid or timestamp to distinguish different runs) and write to it directly.
Print-based approaches also work remarkably well for me while dealing with concurrency or distributed environments: once the logs are stitched together reasonably well things become far more readable and understandable.
Another trick I like to rely on is to log stack traces explicitly from interesting points just to see how the function I care about is getting called. If you're using python, you can also include arguments along all the frames, or use something even more sophisticated like Panopticon.
Use a debugger
If you have a good enough setup to easily attach a debugger and run the program fast enough, step through it, save your breakpoints, and try playing with the program as it runs. Being able to quickly walk through the full state of the program without having to choose what to log upfront can speed up changes a lot.
Sometimes, though: debuggers can be flaky, misleading (by disabling optimizations) or simply slow down execution enough to be impractical. Ideally, you should have some idea of how your particular debugger works – and how it causes the observed program to change.
I generally dislike the ephemerality of a debugger: my breakpoints and state get lost across program restarts, crashes, disconnects and other banalities of life. Wherever possible, I prefer to insert breakpoint calls directly into my code so I can maintain them across debugging sessions. For example:
- Python
Python lets you insert the snippet `breakpoint()` to trigger PDB; you can also use `import ipdb; ipdb.settrace()` if you have ipdb as a dependency. There's also the option to use the environment variable `PYTHONBREAKPOINT` to customize the function called through `breakpoint()`.
- JavaScript
Directly use the `debugger;` statement to trigger debugging.
Use a REPL
Even more than a debugger, I particularly enjoy access to a REPL to load and execute code quickly with behavior that seems even closer to how the program would actually run. This works particularly well for Python code – it is the basis for Notebooks – and leads to incredible interactive experiences.
Try to get a REPL that you can easily hot-load code into: `%autoreload` in IPython is incredibly valuable when combined with `pip install -e` – or development mode means you can edit code and run it live instantaneously. The other approach is to `eval` the code you care about to redefine functions, though that feels somewhat more kludgy to me.
If you're lucky (and nearby security engineers maybe not so much) you might get a REPL into a live production system to poke around in and explore.
Tools to navigate your codebase
Index based navigation
The ideal is always a system that lets you jump to the precise function or class you care about, or even with a regular expression. A search engine or IDE that understands the code well is always amazing – IntelliJ shines, and VSCode generally does a good job too with its LSPs. Emacs and Vim users can rely on TAGS.
Github's new code search is another great example, and with a similar URL but different implementation so is Android's repo hosted by Google. Meta recently open sourced Glean if you'd like to host and run your own.
Unfortunately, I should also point out that sometimes index based tools can be misleading – because your codebase will inevitably have code generation, dynamic dependencies, surprising build procedures or some strange edge cases; trust but also verify at runtime. I'll often spin up a REPL in Python and then use Jupyter's ?? magic command to look up the source code that's actually being run.
String based navigation
At the same time (particularly to navigate using fingerprints) I find simple text (or regex) based search invaluable. Ideally you have a system that lets you grep through your code base quickly and painlessly.
At its simplest, hopefully you have a checkout that you can `find` and `grep` your way through with ease; pair it with `sed` and `xargs` to quickly perform simple code-mods. For larger systems that you can't simply grep quickly, ideally you have something like OpenGrok that can let you search for simple strings quickly.
Specific turns of phrase in logs or user facing messages, style names, colors are just some examples of strings that can be surprisingly valuable to pattern match for to effectively look for source code – and generally don't show up in indexes.
Tools to observe your program
Log readers
There are several programs that can help you navigate logs more easily: while there are some excellent UIs and CLIs like The LogFile Navigator, I often find myself dropping into Vim with a copy of the logs. That gives me the ability to search and delete anything I don't care to see, reformat some logs; occasionally copy out a few specific instances and explicitly diff them.
I haven't found anything as convenient as Pandas DataFrames for converting logs for post-processing: starting with a column that simply contains the raw text, it's easy enough to add columns with values parsed out of the raw logs, and then drop them into matplotlib for easy custom visualizations.
Instrumentation: metrics, traces, etc.
Speaking of empirical evidence, there's nothing that can inspire as much confidence – or horror – as seeing live metrics of your code running in production. I've been lucky to use Scuba at work, and I can't overstate the value of being able to quickly aggregate data live as I explore raw samples: hopefully you can arrange for similar flexibility.
The final pillar of observability is traces: these can be very valuable in seeing what's running, and occasionally how fast it's running. Depending on the sophistication of the tracing tools you have available, you might be able to get interesting stack traces extremely quickly. I'll also plug the `@probe` mechanism in Panopticon to trace functions you're interested in learning more about.