Panopticon - a Python tracer
Panopticon is a python tracer to easily visualize and explore Python code execution, particularly asynchronous code. Think of it as a more usable trace module.
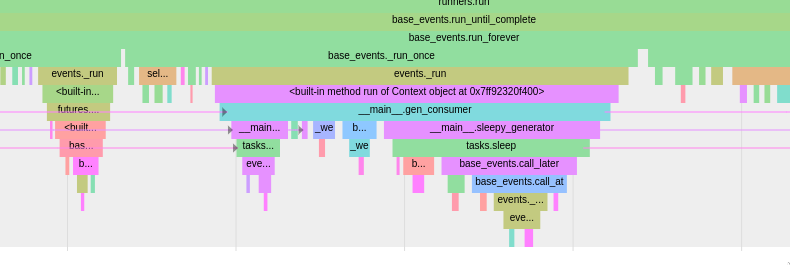
Table of Contents
Installation (PyPI)
pip install panopticon
Generating traces
There are several mechanisms to generate a trace with this module; some invasive while others can be run externally.
Through the CLI
Running through the CLI lets you directly generate a trace without actively instrumenting any code, at the cost of capturing everything that happens.
Direct evaluation
For a short command, it's possible to directly use the module to eval
a snippet of python:
python3 -m panopticon -o hello.trace -c "print(hello, world)"
Running a file
Alternatively, you can run a file and pass arguments to it.
python3 -m panopticon -o hello.trace hello.py arg1 arg2
With a context manager
Sometimes, you want to look at a very specific piece of code being executed instead of trying to capture everything; just to reduce the noise and overhead.
from panopticon.tracer import AsyncioTracer

with AsyncioTracer() as at:
    print("Hello, world!")

with open("../static/panopticon/example.trace", "w") as trace_file:
    trace_file.write(str(at.get_trace()))
Visualizing the traces
Catapult
Panopticon relies on Chrome's Catapult for visualization and generates a trace compatible with it; this lets you zoom in / out, search for a specific function, and even see how different frames are continued across generators and coroutines with arrows.
On chrome, directly visit chrome://tracing to open the tracer, and
then load the trace file from the top left. Alternatively, a version
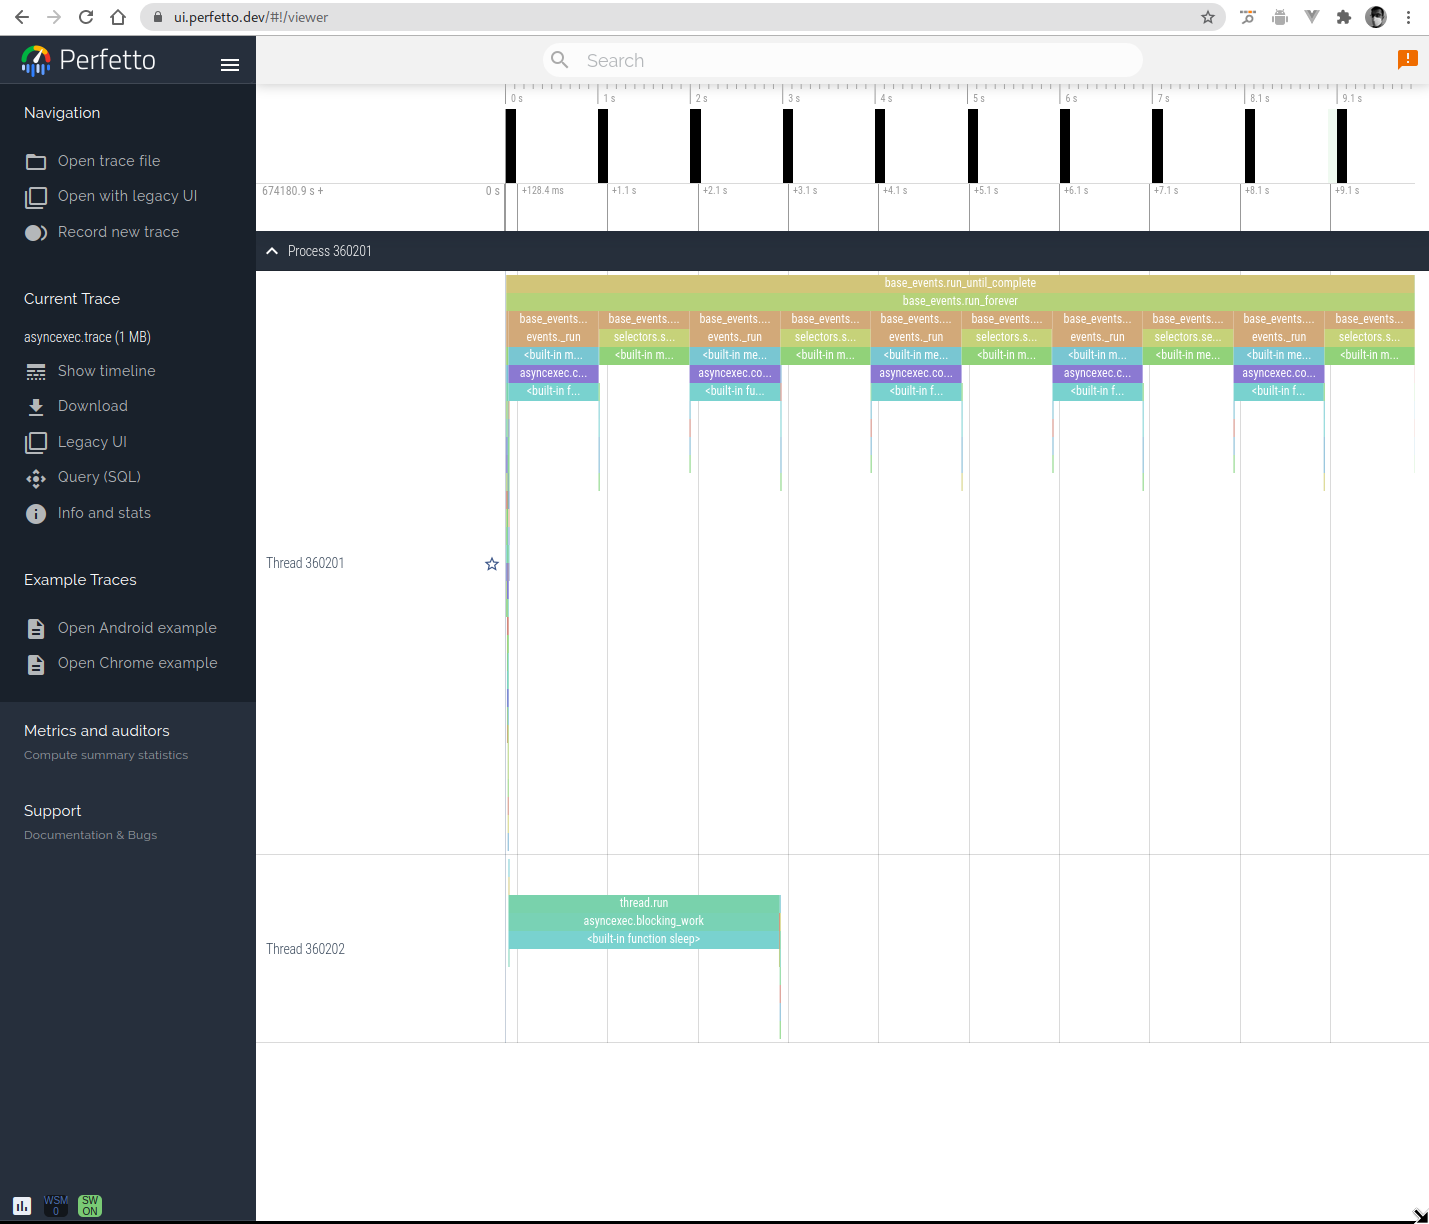
of Catapult is also hosted at Perfetto.
(You can download the trace used for these screenshots if you'd like to play with it live.)
And others
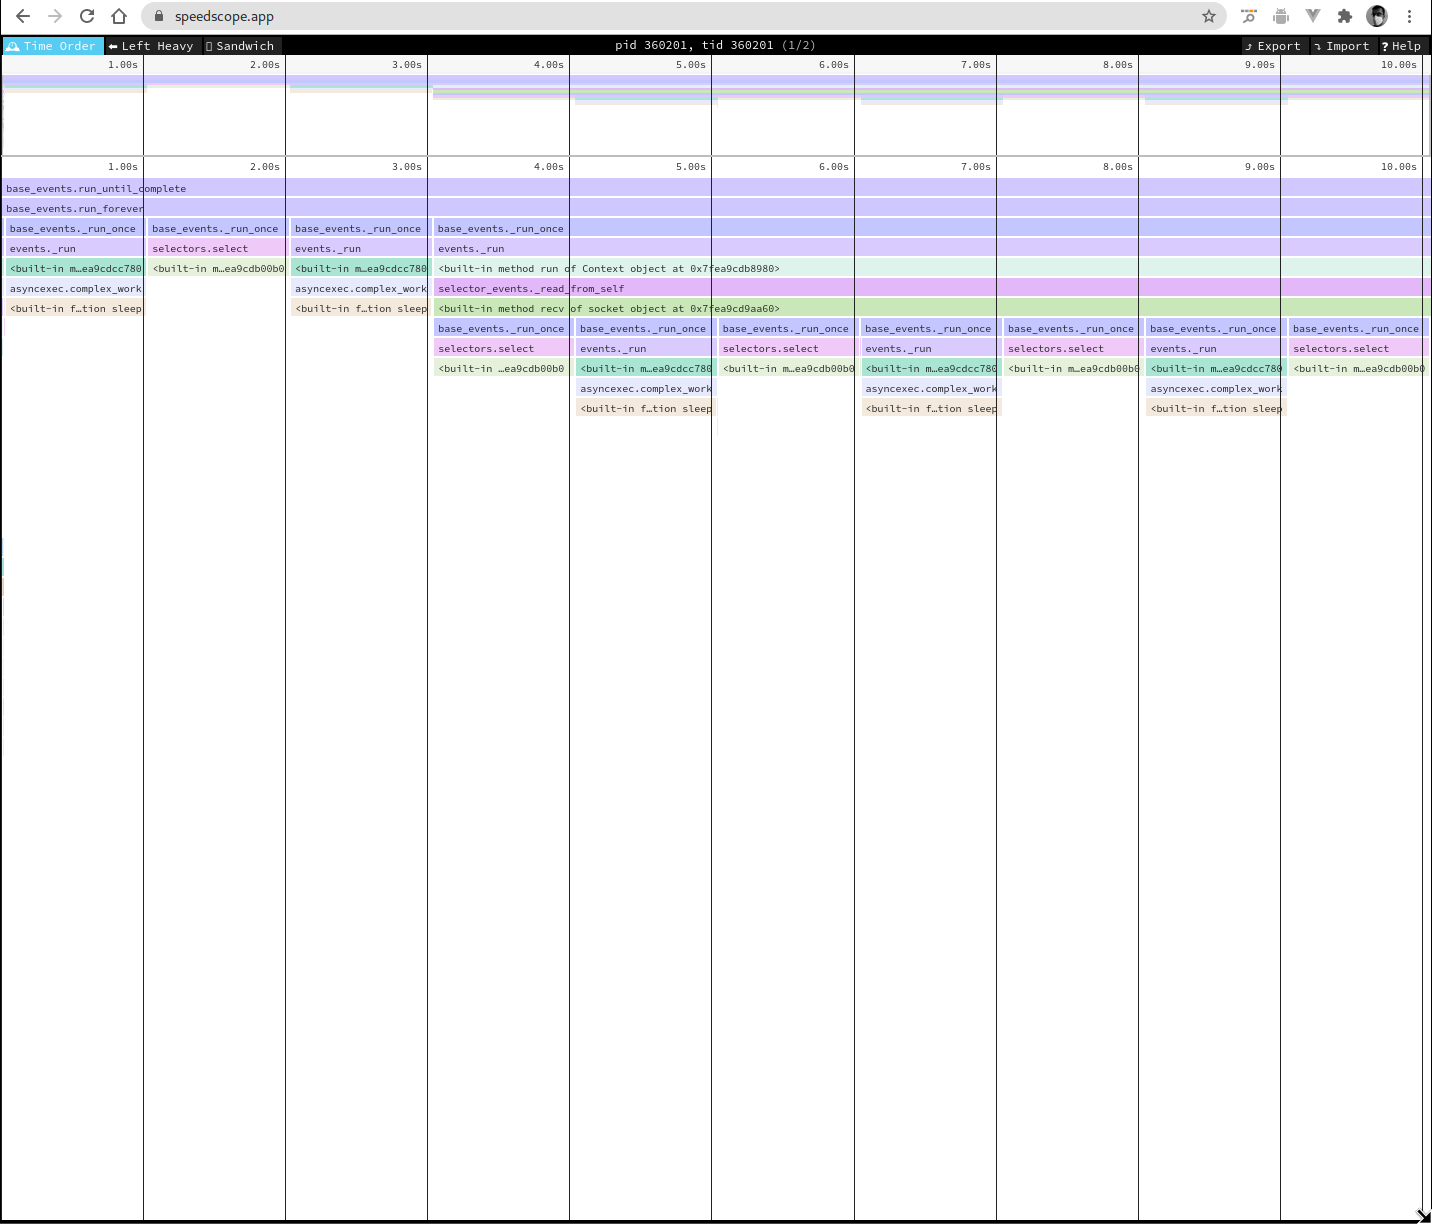
Other alternatives include Perfetto and Speedscope, but they don't support connecting frames with flow events. On the other hand, they tend to be much smoother, even for larger traces and should come in handy as alternatives.
Examples
My favorite way to learn a new tool is to start by applying it to something I already know well. Once I'm comfortable with what it's telling me, I wander off to explore and learn.
To help you ramp up quickly, I'm going to do the same here with some interesting traces. The titles are linked to the raw trace files: I'd recommend downloading them and playing with them instead of just looking at screenshots!
Hello, world! - Trace
Perhaps the one program I'm certain you've seen before:
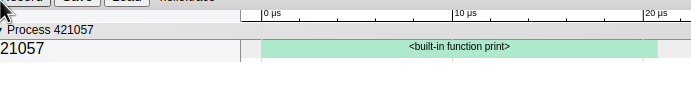
print("Hello, world!")
Hello, world!
(For readability, I'm eliding the surrounding code to actually take a trace; and tangling it in the org-document instead. See the org source of this document.)
Happily, the trace output is fairly anti-climatic: a single frame
showing a "print".
Fizz Buzz
Let's do something incredibly complicated: print the numbers from 1…100, with Fizz in case they're divisible by 3, Buzz in case they're divisible by 5 and FizzBuzz if they're divisible by both.
for x in range(1, 101):
    if x % 15 == 0:
        print("FizzBuzz", end=" ")
    elif x % 3 == 0:
        print("Fizz", end=" ")
    elif x % 5 == 0:
        print("Buzz", end=" ")
    else:
        print(x, end=" ")
1 2 Fizz 4 Buzz Fizz 7 8 Fizz Buzz 11 Fizz 13 14 FizzBuzz 16 17 Fizz 19 Buzz Fizz 22 23 Fizz Buzz 26 Fizz 28 29 FizzBuzz 31 32 Fizz 34 Buzz Fizz 37 38 Fizz Buzz 41 Fizz 43 44 FizzBuzz 46 47 Fizz 49 Buzz Fizz 52 53 Fizz Buzz 56 Fizz 58 59 FizzBuzz 61 62 Fizz 64 Buzz Fizz 67 68 Fizz Buzz 71 Fizz 73 74 FizzBuzz 76 77 Fizz 79 Buzz Fizz 82 83 Fizz Buzz 86 Fizz 88 89 FizzBuzz 91 92 Fizz 94 Buzz Fizz 97 98 Fizz Buzz
This one is just a little bit more noisy: the only actual function calls are to print, and that's all we see.

I was a surprised to see that all calls to print weren't taking the same amount of time:
- One possible reason is that the process was swapped out for other processes; remember that panopticon is showing wall time and not cpu time.
- The other is that print ends up flushing far into the trace, and that's one that I can test a little bit more easily. (Trace)
def p(x):
    print(x, end=" ", flush=True)

for x in range(1, 101):
    if x % 15 == 0:
        p("FizzBuzz")
    elif x % 3 == 0:
        p("Fizz")
    elif x % 5 == 0:
        p("Buzz")
    else:
        p(x)
1 2 Fizz 4 Buzz Fizz 7 8 Fizz Buzz 11 Fizz 13 14 FizzBuzz 16 17 Fizz 19 Buzz Fizz 22 23 Fizz Buzz 26 Fizz 28 29 FizzBuzz 31 32 Fizz 34 Buzz Fizz 37 38 Fizz Buzz 41 Fizz 43 44 FizzBuzz 46 47 Fizz 49 Buzz Fizz 52 53 Fizz Buzz 56 Fizz 58 59 FizzBuzz 61 62 Fizz 64 Buzz Fizz 67 68 Fizz Buzz 71 Fizz 73 74 FizzBuzz 76 77 Fizz 79 Buzz Fizz 82 83 Fizz Buzz 86 Fizz 88 89 FizzBuzz 91 92 Fizz 94 Buzz Fizz 97 98 Fizz Buzz

And this does end up being slightly more even. I'm suspect I'm going to add cpu time profiling to panopticon to investigate this later.
Also note that the helper function p ends up creating an additional
frame: the pink blocks correspond to p, and the cyan blocks correspond
to print.
Importing a module (Trace)
Moving on, lets try something we're all done without really thinking deeply about it: importing a library.
import random
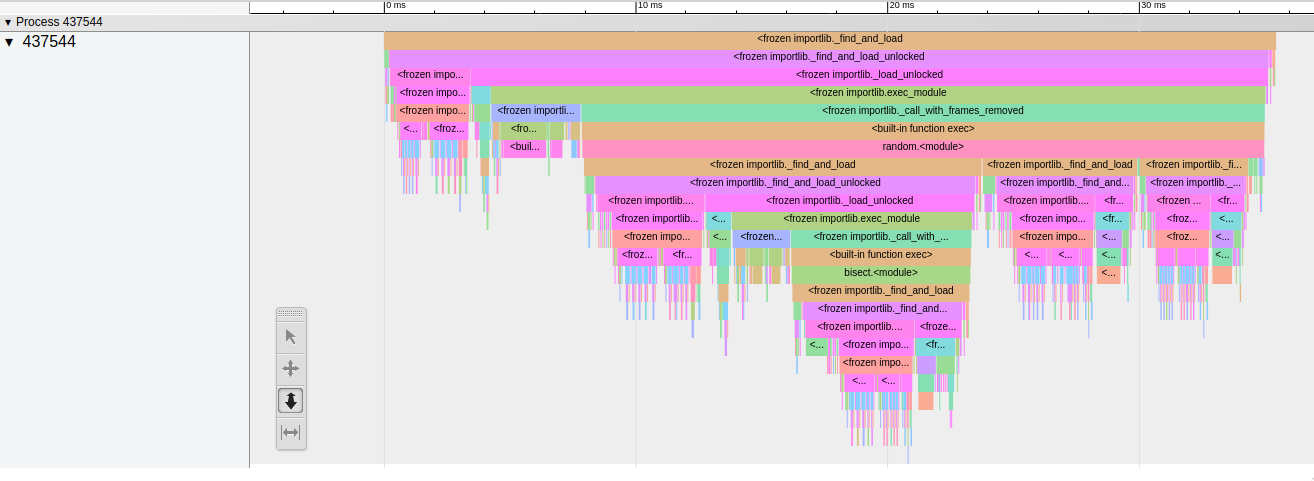
This might be a little surprising: a lot of work goes into
import. Python's current implementation of import is in importlib,
which is what shows up in the trace; frozen indicates that the
importlib module shipping in python is frozen (I need to learn more
about this as well).
Exploring asyncio execution (Trace)
Fun fact: my main motivation for build panopticon was to be able to look at and grok async code comfortably and quickly. Particularly code written by others.
I've talked about showing resumed frames a couple of times: I can finally show you. With a somewhat frivolous example, I'm going to have Python type out "Hello, World" with a generator, and an async consumer that sleeps along the way.
import asyncio

def gen_text(text):
    for c in text:
        yield c

async def print_slowly(gen):
    for val in gen:
        print(val, end="", flush=True)
        await asyncio.sleep(.002)

asyncio.run(print_slowly(gen_text("Hello, world!")))
Hello, world!
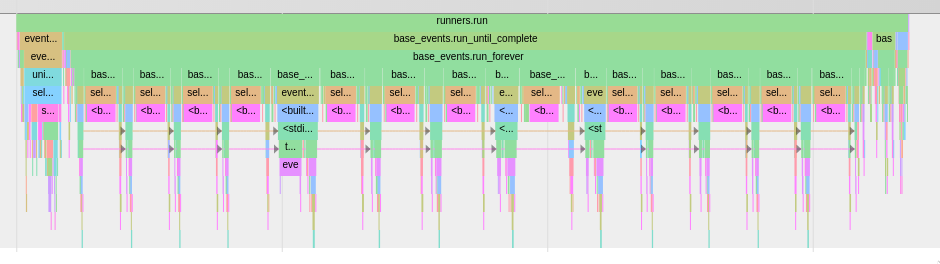
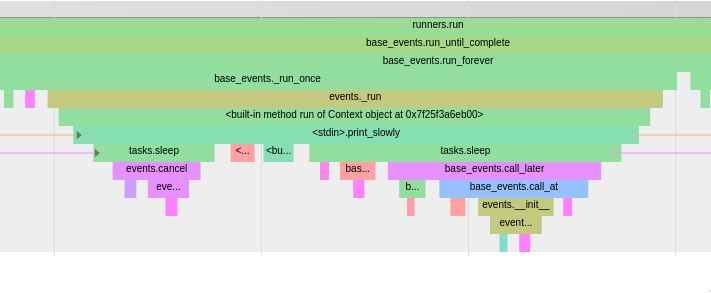
The outline looks fairly reasonable: there's a significant amount of machinery that gets set up to run asyncio.
One limitation to note is that Panopticon can't intercept the point at which a generator or a coroutine is created: so you won't see the point at which a coroutine was created (though the origin can be made available).
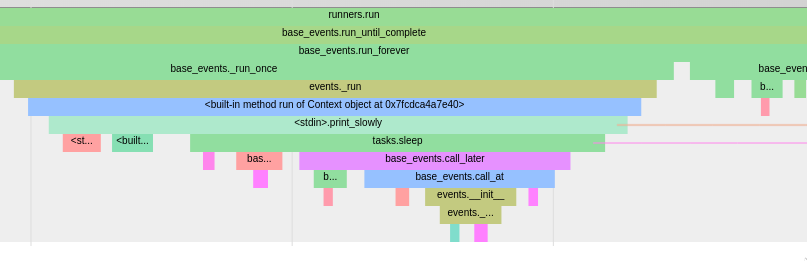
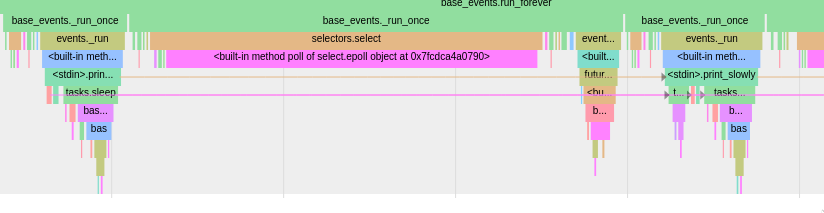
Zooming in, the frames mostly make sense: an outer run call from the
event loop; followed by print_slowly; the snipped <st is actually
<stdin>.gen_text, followed by the call to sleep. (There is probably a
little bit of improvement I should be able to do to the names showing
up within panopticon).
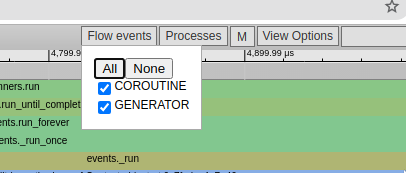
I can enable/disable the arrows by toggling "Flow Events" in the catapult UI: this is the one feature that isn't available in alternate visualization tools and the reason all of my examples use catapult instead.
With all the arrows enabled, you can also see the generator's blocks connected to each other, asyncio.sleep connected in parts, and the coroutine's blocks connected together as well.
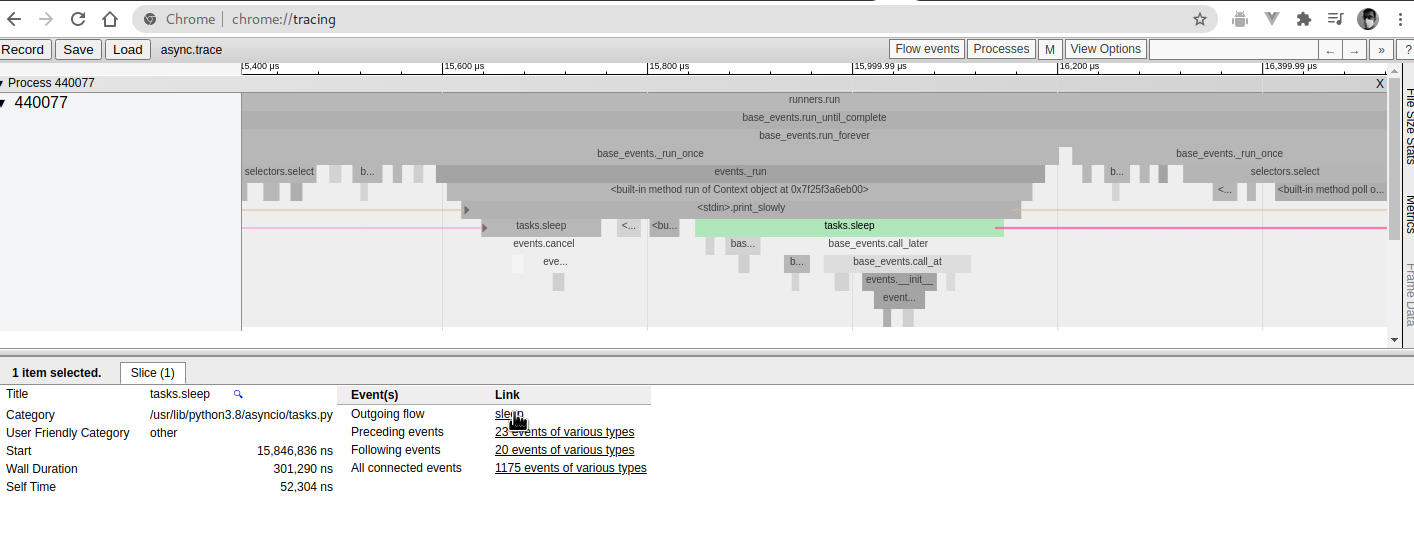
You can also see that the asyncio.sleep coroutine does not continue
across executions of the loop; each time the coroutine is invoked it's
a new instance that lasts across print_slowly giving up control to the
event loop.
There's a significant amount of information available at the bottom to make it easier to navigate. Hovering on the elements also highlights that element, making it much easier to read.
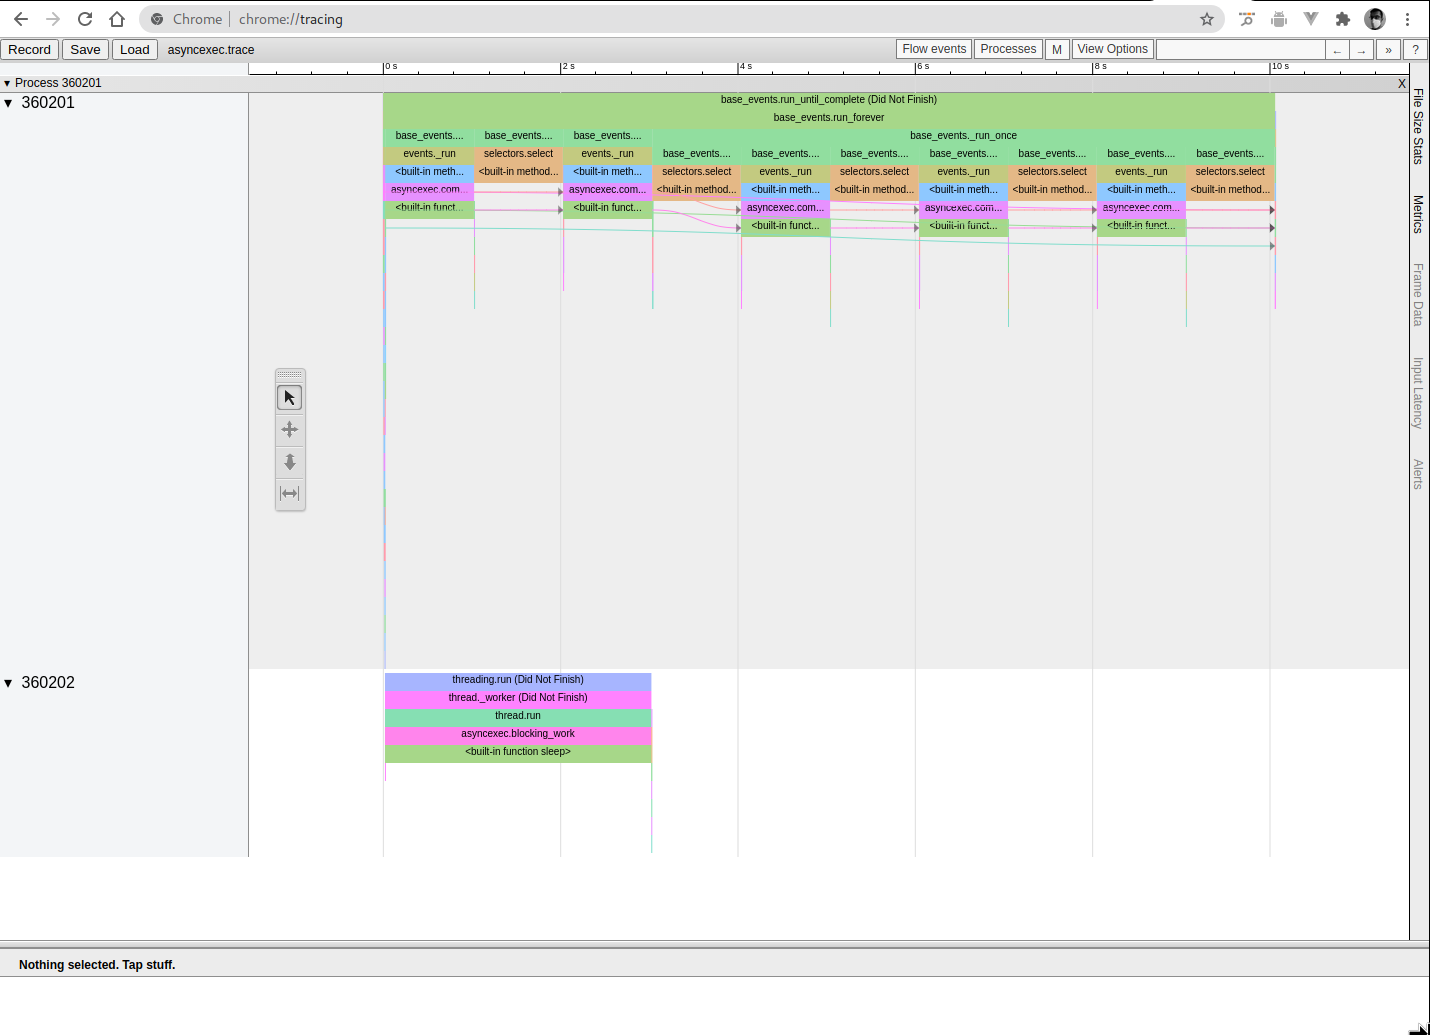
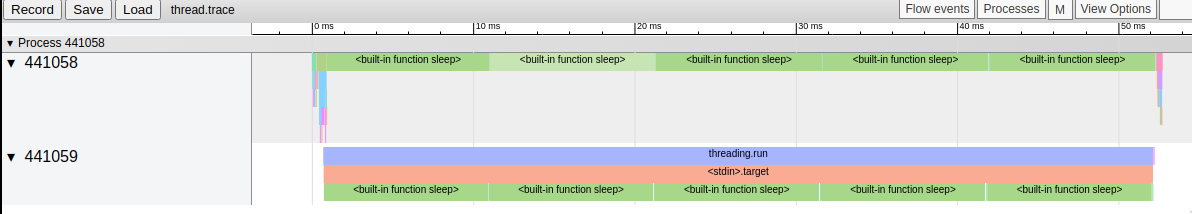
Multi-threading (Trace)
Finally, thanks to threading.setprofile, it's also possible to track
execution across multiple threads. As I call out in the Limitations
section, Panopticon (and sys.setprofile) is blind to CPU context
switches, so you shouldn't believe that your Python code is actually
running in parallel; it's only concurrent.
import threading
import time

def target():
    for x in range(5):
        time.sleep(.01)
        print(f"Hello {x}, secondary thread")

thread = threading.Thread(target=target)
thread.start()

for x in range(5):
    time.sleep(.01)
    print(f"Hello {x}, main thread")

thread.join()
Hello 0, secondary thread
Hello 0, main thread
Hello 1, secondary thread
Hello 1, main thread
Hello 2, secondary thread
Hello 2, main thread
Hello 3, secondary thread
Hello 3, main thread
Hello 4, secondary thread
Hello 4, main thread
And here we see both functions running concurrently: the print calls are tiny enough that their blocks are hidden between the sleeps and only show up if you zoom in aggressively.
I hope these examples make it significantly easier to understand traces you might run on far more complex programs; or even on very simple native python code to understand what exactly is happening.
Limitations
No thread switches
sys.setprofile is blind to os-level thread switches, which means it'll
apparently show you true parallelism happening in Python. These traces
are simply wall time for when a function starts and stops, and you
shouldn't assume that this particular piece of code was actively
running on the CPU.
Performance overhead
There's some additional python now running on every single function call, and creating objects along the way consuming memory. I plan to add a native implementation (similar to cProfile as a counterpart to profile) to help reduce the overhead.
Internals
Python has excellent introspection, with sys.setprofile and similar
functions exposing the ability to intercept every single opcode.
Panopticon adds a custom profiler function that gets triggered on every frame entry/exit, and generates events corresponding to the Catapult trace format.
For connecting and tracking coroutines, generators (async and
otherwise) it maintains the id of the active frame in memory till the
frame in question runs RETURN_OPCODE.
This was fairly fun to figure out, as was realizing that the id for consecutive calls to async functions in a loop would stay the same because the new frame would end up in the same location in memory.
Roadmap
There are several improvements I'd like to make; at the same time this is a side project for fun so I'm not targeting specific dates.
Improved interaction
(Quick convenience functions to comfortably use this module.)
- Be able to run modules directly through the CLI
- Add a decorator function for tracing
- Have a non-specific tracer
- Add a
save_traceto create files - Allow different rendering modes, including opcode tracing
- Clean up the extra "exec" inserted while running through the CLI
- Allow streaming output
- Use an audit hook to catch if someone overrides the profiler
CPU counters
- It's probably worth investigating if CPU counters, and per-thread cpu counters make sense and give valuable visualizations.
Add support for capturing arguments
(These should make it possible to use Panopticon as a reproducible alternative to a debugger that's not as primitive as a print.)
- Add support for including arguments and return values, and filtering them as well.
Add support for filtering frames and arguments
- Allow limiting the captured frames by module, function name, etc. and an arbitrary predicate.
Add a native implementation
- Implement a version in rust to avoid the overhead of creating and maintaining data in Python.
- Generate protobuf output to shrink the traces.
Add support for tracing a running program
- This will involve a completely new approach: instead of emulating how PDB does it, I'll have to imitate GDB instead.
- This should also make it feasible to trace into native code.
Feedback?
This is my first Python module; I'd be delighted to receive any feedback by email, on Twitter, or directly on the project on Github.